|
SEA LEVEL OSCILLATIONS IN A SALT MARSH LAGOON SYSTEM, NORTH INLET,
SOUTH CAROLINA
Trabajo recibido el 1° de noviembre de 1982 y
aceptado para su publicación el 22 de noviembre de 1982.
FRANKLIN B. SCHWING
Skidaway Institute of Oceanography, Savannah, Georgia 31406,
U.S.A.
BJÖRN KJERFVE and JAMES E. SNEED
Belle W. Baruch Institute for
Marine Biology and Coastal Research and the Marine Science Program, University
of South Carolina, Columbia, South Carolina 29208, U.S.A. Contribution from the
Belle W. Baruch Institute for Marine Biology and Coastal Research. NSF Grants
DEB76-83010.
Las variaciones en el nivel del mar
que ocurren a lo largo de la costa con escalas que fluctúan desde unas
pocas horas hasta varios años son principalmente producidas por 1)
mareas astronómicas, 2) fuerzas meteorológicas y 3) fluctuaciones
estérica en la costa. En el sistema de lagunas costeras de North Inlet,
Carolina del Sur, Estados Unidos, ochenta y ocho por ciento de la variabilidad
en el nivel del mar se debe a componentes de mareas semidiurnas (75%) y diurnas
(13%). Las variaciones meteorológicas inducidas ocurren en escalas de 2
a 14 días y constituyen 4% de la varianza total. Estas fluctuaciones
probablemente son de significado ecológico. El ciclo estacional, alto en
septiembre y bajo en febrero está relacionado con el ciclo de la
temperatura del agua y constituye 7% de la varianza en el nivel del
mar.
Variations in coastal sea level on scales from a few
hours to several years are mainly produced by 1) astronomical tides; 2)
meteorological forcing; and 3) steric fluctuations in the costal ocean.
Eighty-eight percent of the variability in sea level in North Inlet, South
Carolina, a U.S. salt marsh lagoon system, is due to semidiurnal (75%) and
diurnal (13%) tidal components. Meteorologically induced variations occur on
time scales from 2 to 14 days and account for 4% of the overall variance. These
fluctuations are likely to be of ecological significance. The seasonal cycle,
September high and February low, is related to the water temperature cycle and
accounts for 7% of the sea level variance.
The water level in estuaries and lagoons fluctuates over a wide range of periods. The most obvious oscillation is usually the semidiurnal or diurnal tide due to astronomical forcing. However, meteorological forcing and variability in fresh water runoff may also cause large fluctuations of sea level on the scale of a few days. Astronomical forcing additionally causes sea level oscillations of a few hours, 24.8 hours, 14 days, 18.6-19-1 Years, and longer. There also exist 20 000-100 000 year periodic variations due to glaciation cycles. Further, there exist seasonal sea level cycles (Pattullo et al., 1955) because of water temperature changes. Particular locations may experience sea level cycles with periods from 20-365 days. Provis and Radok (1979) identified such phenomena along the Australian coast but did not give a definitive explanation. The purpose of this paper is to focus attention on the existence of meteorologically induced sea level variability with periods most1y from 3 to 14 days. We will do this by analyzing 3 years of hourly water elevation data from North Inlet, South Carolina, a salt marsh lagoon system along the U.S. Atlantic coast (Fig. 1). There are several important ecological implications of such non-tidal sea level oscillations. The extent of flooding of adjacent marshes, mud flats, and grass beds depends on sea level height. Kjerfve and McKellar (1980) suggested that the exchange of nutrients and organics between marsh and adjacent lagoon waters is a function of the degree to which marshes are flooded. Also, it may well, be that meteorological sea level variations drive material exchanges of dissolved and susp-ended constituents between the coastal ocean and lagoons/estuaries. 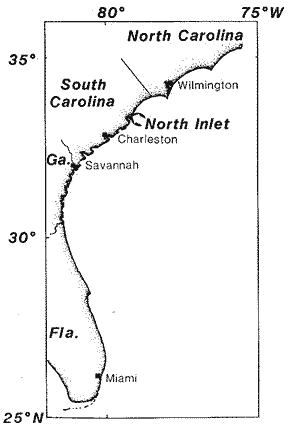 Fig. 1. Location of North Inlet, South Carolina. PROCEDURENorth Inlet, South Carolina (Fig. 1) is a 32.2 km² salt marsh (Spartina alterniflora) lagoon system bordering on the Atlantic Ocean. Numerous winding tidal creeks, intersect the marsh. Salinities are sually 31-34 ppt because of the lack of significant fresh water runoff. Analog tide measurements were made with a Weather Measure F551 recording water level gauge. A stilling well. filtered water level fluctuations shorter than 5 minutes. Three years of data were used for our analysis a) 1 june 1974-31 May 1975; b) 1 September 1978-31 August 1979; and c) 1 September 1979-3l August 1980. These three 365-day series were digitized at an hourly sampling rate. They were smoothed using an 8th order, bidirectional, Butterworth filter with a 48 hr half-gain period to illustrate the non-tidal. low-frequency varíations in sea level. Oscillations with periods shorter than 24.82 hours are attenuated by a factor of more than 2.5 x 10⁻⁵ while the semi-diurnal tide is suppressed by a factor of 3 X 10⁻¹⁰. 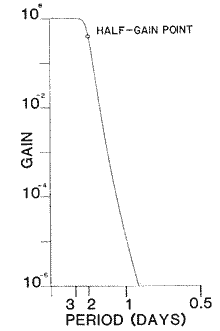 Fig. 2. Gain of an Sth order, bidirectional Butterworth filter with a 48 hour gain equal to 0.5. The digital Butterworth filter is easily realized in serial form (Ackroyd, 1973). As recursive filters produce data phase shifts, each series was serially filtered in both a forward and reverse direction. The resulting filter has no associated phase shifts (Roberts and Roberts, 1978). Its gain, H, is given by H (f) = ( 1 + (tan πfΔ t/tan πfcΔt) ²n)-¹ where f (cph) is frequency; fc (cph) is the frequency at which the filter gain is 0.5; and n is the order of filter as well as an indicator of the number of points lost at each end of the filtered data because of the filtering operation. The frequency gain of the 8th order, 48 hr half-gain period filter is shown in Fig. 2. RESULTS AND DISCUSSIONFast Fourier Transform (FFT) variance spectra were calculated for each unfiltered time series. The spectrum (Fig. 3) is the resultant of the three annual data sets, calculated with 30 degrees of freedom per spectral estimate. 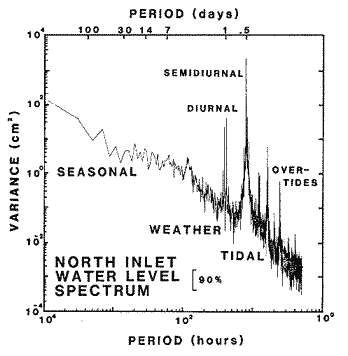 Fig. 3. Rariance spectrum of the North Inlet water level. This resultant spectrum wa3 constructed as the mean of three annual spectra with each variance estimate having 30 df. The sampling rate is 1 hr and, thus, the Nyquist frequency is 0.5 cp1i. M., S, and N are the major semi diurnal tidal peaks, K, and 01 the dominant diurnal tidal peaks and the peaks at higher frequencies, M2 and M4 are important overtides. The 90%, confidence interval is shown. The spectrum is dominated by tidal cons, tituents, as can be expected. North. Inlet experiences a semidiurnal mesotide with a mean range of 1.4 m, which explains 75% of the total vaiance in the sea level records. Diurnal constituents (24.8 hour period) account for 13% of the total variance. The diurnal range varies from 6 cm (equatorial tides) to 35 cm (tropic tides) (Palmer et al., 1980). Although several overtide species (cf. Doodson and Warburg, 1941) are evident in the spectrum (e.g., M4 - 6.2 hours period, M6 - 4.2 hour period) , neither the M4 nor the M6 constituent contributes significantly to the overall spectral variance. The tidal fortnightly cycle, a sea level variation associated with the spring-neap cycle due to the declination of the moon, is apparent in the spectrum (Fig. 3) and contains approximately 1% of the overall spectral variance. High spectral values at periods of 27 and 50 days could correspond to variability in the length of day and global angular momentum, respectively. The low-pass filtered sea level records are shown in figure 4. It is apparent that there exist significant sea level variations with periods from 2 to 14 days. In fact, these highly energetic oscillations account for 4% of the overall variance, exhibit a range from 25 to 80 cm, and occur throughout the year in all three data sets (Fig. 4). However, as these variations do not occur at precise periods, there exists no corresponding distinct peak in the sea level spectrum (Fig. 3) ; rather the frequency band as a whole is energetic. Although 2-14 day sea level oscillations exist throughout the year, the winter fluctuations are more intense and more frequent as compared to summer occurrences. Brooks and Mooers (1977a) found 7-10 day and 12-14 day periodici ties in the winter and summer time records, respectively. The seasonal difference is clearly evident in the North Inlet summer and winter sea level spectra (Fig. 5) as well. This difference is due to the regular passage of meteorological fronts during late fall and winter. Such fronts are less intense and less regular during the summer, consistent with the lower variance in the 2-14 day band during summer. 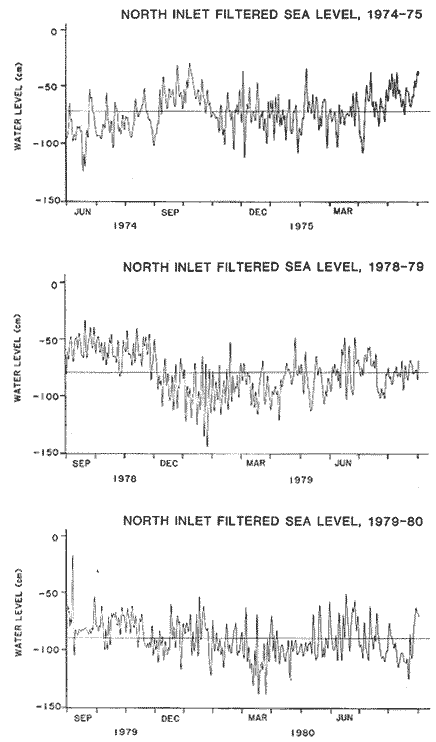 Fig. 4. Low-pass filtered sea leved records for North Inlet for 1974-75, 1978-79, and 1979-80. Non-tidal low-frequency sea level fluctuations are associated with meteorological forcing. However, the dynamics of such oscillations are poorly understood, and they are not easily predictable. Kjerfve et al. (1978) showed that sea level variations from 2-10 days in North Inlet are coherent with atmospheric pressure variations and wind stress, thus dependent on the passage of frontal systems. A high correlation between water elevation and wind stress along the U.S. east coast was also demonstrated by Blanton and Maddox (1978) and Chao and Pietrafesa (1980). Sea level variations may be manifestations of continental shelf waves, as well. Brooks (1978) found a coupling between atmospheric forcing and sea level variation at periods of 3 and 10 days, approximating the 12-day period of zero group speed barotropic continental shelf waves (Brooks and Mooers, 1977b) and spinoff eddies that propagate across the continental shelf (Lee and Mayer, 1977). 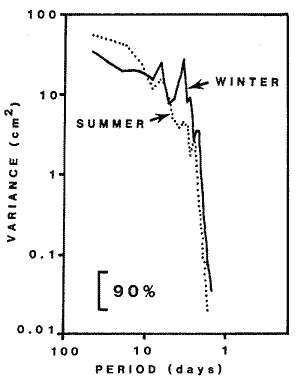 Fig. 5. Comparison of the low-passed filtered sea level spectra for December-February (winter) and june-August (summer) for the mean of the three years. Each. Spectral estimate has associated 18 df. Our main objective in this paper is to focus attention on the existence of energetic wavefeatures in lagoonal/estuarine sea level records. These have periods from 2 to 14 days, may have heights up to 80 cm, and are caused by direct meteorological forcing or indirectlly by meteorological forcing transferred via the coastal ocean. These waves, (Fig. 4), which cannot be predicted, may have important ecological implications. Associated with the sea level oscillations are water discharges, also on time scales from 2 to 14 days, which may be responsible for net exchanges of waterborne materials between coastal ocean and lagoon/estuary. In addition, an astronomical high tide occurring at the time of the passage of a lowfrequency wave crest will cause more extensive flooding of adjacent marshes, swamps, and grass and mud flats than a high tide at the time of a lowfrequency wave trough passage. As Kjerfve and McKellar (1980) suggested, it is particularly during times of wetlands flooding that nutrients and detritus are likely to be exchanged between lagoon waters and the perimeter of the tidal watershed. Thus, measurement of material fluxes or computation of material budgets based on only a few tidal cycles may result in biased or totally erroneous conclusions. It may be necessary to relate measurements to the underlying lowfrequency sea level fluctuations to verify that material flux estimates are not biased toward times of either rising or falling low-frequency sea level. One notable event occurs in the beginning of the 1979-80 data set (Fig. 4c). The anomalously high low-pass filtered water elevation in early September corresponds to the passage of Hurricane David along the southeastern U.S. coast. Although meteorological sea level variations account for only 4% of the total variance, such variations are still significant. The percentage is small because North Inlet experiences a large tidal range. However, meteorologically induced sea level fluctuations of similar magnitudes can be expected for most coasts. Thus, in regions experiencing microtides, the low-frequency sea level waves can easily account for 50% of the variance, depending on local conditions, and thus achieve a larger relative importance. Such microtidal regions are common throughcut the Gulf of Mexico and Caribbean Sea. The remaining 7% of the sea level variance is associated with seasonal fluctuations of periods in excess of a month. The characteristic annual sea level variation is a high in September-October and a low level in February (Fig. 6). The range of this cycle is on the average of 25 cm. According to Pattullo et al. (1955), most of the seasonal oscillation is due to steric changes in the water column, primarily as a result of the annual temperature cycle. 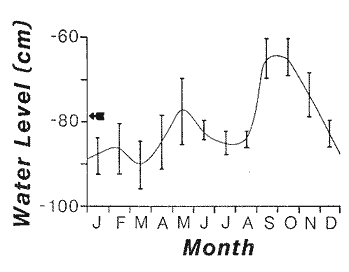 Fig. 6. Annual sea level curve for North Inlet with mean values for cach month ± the standard error of the mean, based on the three data years. LITERATURAACKROYD, M. H. Digital filters. The Butterworth Group. London 1973 82 p. BLANTON, J. 0. W. C. MADDOX, Jr. Data report on sea level fluctuations in the South Atlantic Bight, 1977. Report to U.S. Department of Energy. 1978 11 p.+ appendix. BROOKS, D. A. Subtidal sea level fluctuations and their relation to atmospheric forcing along the North Carolina coast. Journal of Physical Oceanography 1978 481-493 8 BROOKS, D. A. C. N. K. MOOERS Windforced continental shelf waves in the Florida current. Journal of Geophysical Research 1977a 2569-2576 82 BROOKS, D. A. C. N. K. MOOERS Free, stable continental shelf waves in a sheared, barotrophic boundary current. Journal of Physical Oceanography 1977b 380-388 7 CHAO, S. Y. L. J. PIETRAFESA The subtidal response of sea level to atmospheric forcing in the Carolina Capes. Journal of Physical Oceanography 1980 1246-1255 10 DOODSON, A. T. H. W. WARBURG Admiralty Manual of Tides. Her Majesty's Stationary Office. London 1941 270 p. KJERFVE, B., J. E. GREER R. L. CROUT Lowfrequeney response of estuarine sea level to nonlocal forcing Estuarine Interactions (Wiley, M. L., ed.). Academic Press New York 1978 p. 497-513. KJERFVF, B. H. N. McKELLAR, Jr. Timeseries measurements of estuarine material fluxes. Estuarine Perspectives (Kennedy, V. S., ed.). Academic Press New York 1980 p. 341-357. LEE, T. N. D. A. MAYER Low frequency current variability and spinoff eddies along the shelf off southeast Florida. Journal of Marine Research 1977 193-220 35 PALMER, M. A. B. KJERFVE F. B. SCHWING Tidal analysis and prediction in a South Carolina estuary. Contributions in Marine Science 1980 17-23 23 PATULLO, J. W. MUNK, R. REVELLE E. STRONG The seasonal oscillation in sea level. Journal of Marine Research 1955 88-156 14 PROVIS, D. G. R. RADOK Sea-level oscillations along the Australian coast. Australian journal of Marine and Freshwater Research 1979 295-301 30 ROBERTS, J. T. D. ROBERTS Use of the Butterworth lowpass filter for oceanographic data. Journal of Geophysical Research 1978 5510-5514 83
|